Zabbix_server 3.0.5
Zabbix_agentd 3.0.4
在windows客户端获取网卡参数列表:
typeperf -qx | find "Network Interface" | find "Bytes"
\Network Interface(Red Hat VirtIO Ethernet Adapter)\Bytes Total/sec
\Network Interface(Red Hat VirtIO Ethernet Adapter _2)\Bytes Total/sec
\Network Interface(Red Hat VirtIO Ethernet Adapter)\Bytes Received/sec
\Network Interface(Red Hat VirtIO Ethernet Adapter _2)\Bytes Received/sec
\Network Interface(Red Hat VirtIO Ethernet Adapter)\Bytes Sent/sec
\Network Interface(Red Hat VirtIO Ethernet Adapter _2)\Bytes Sent/sec
可直接保存为文件方便查看
[typeperf -qx | find "Network Interface" | find "Bytes" > c: \network.txt]
由此看出 此台windows服务器有两块网卡在启用状态分别是
Network Interface(Red Hat VirtIO Ethernet Adapter)
\Network Interface(Red Hat VirtIO Ethernet Adapter _2)
在zabbix_agentd.conf添加
#NETWORK
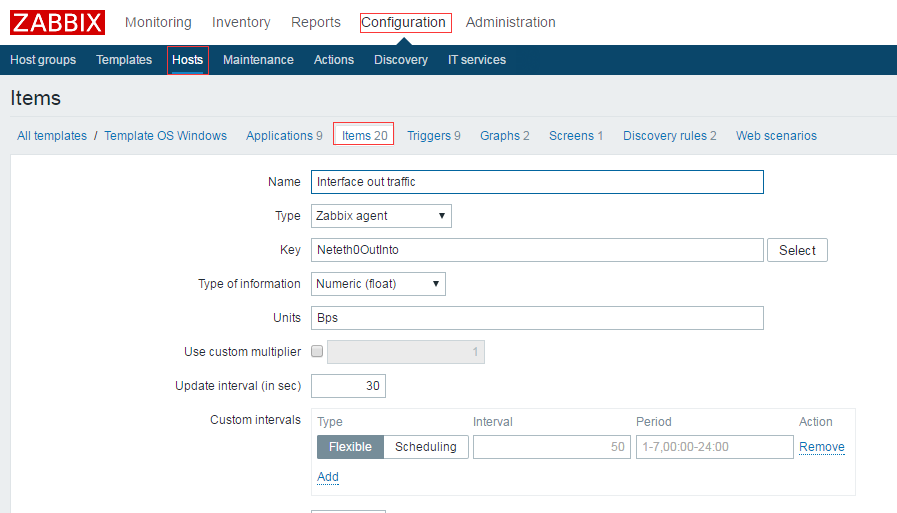
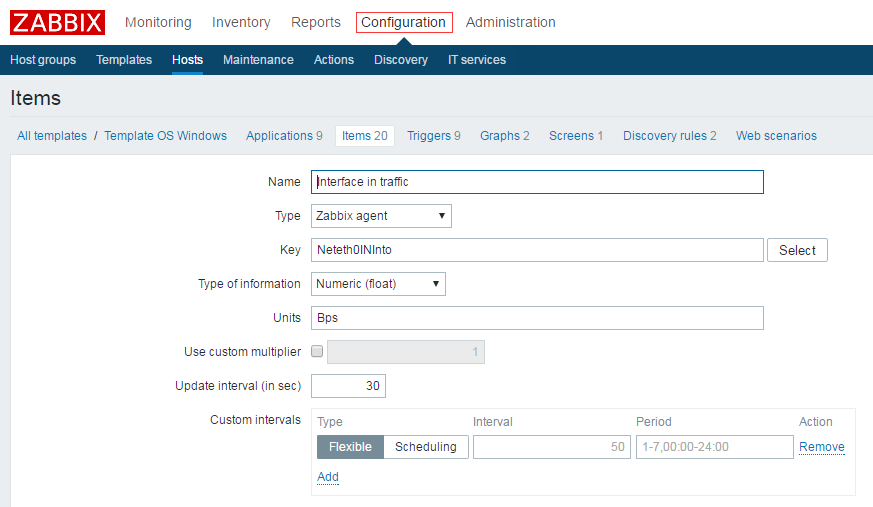
PerfCounter = Neteth0INInto,"\Network Interface(Red Hat VirtIO Ethernet Adapter)\Bytes Received/sec",30
PerfCounter = Neteth0OutInto,"\Network Interface(Red Hat VirtIO Ethernet Adapter)\Bytes Sent/sec",30
修改配置后重新启动zabbix_agentd.exe后通过Zabbix-Server端

Configuration--Templates--Template OS Windows--Item--Create item
添加监控项
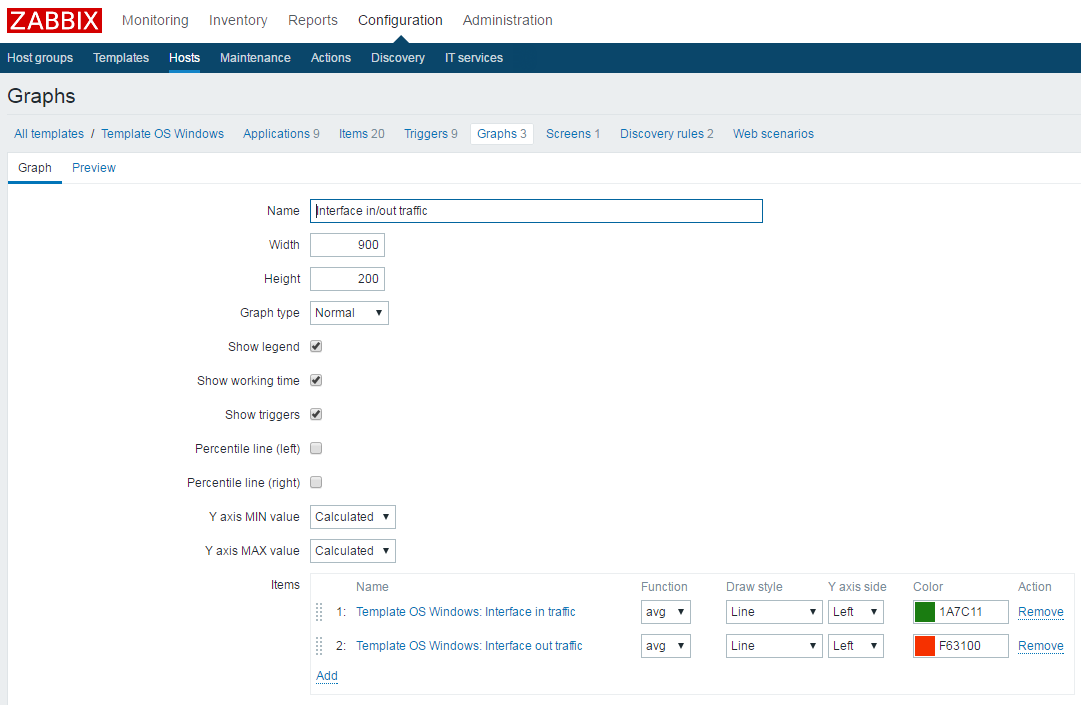
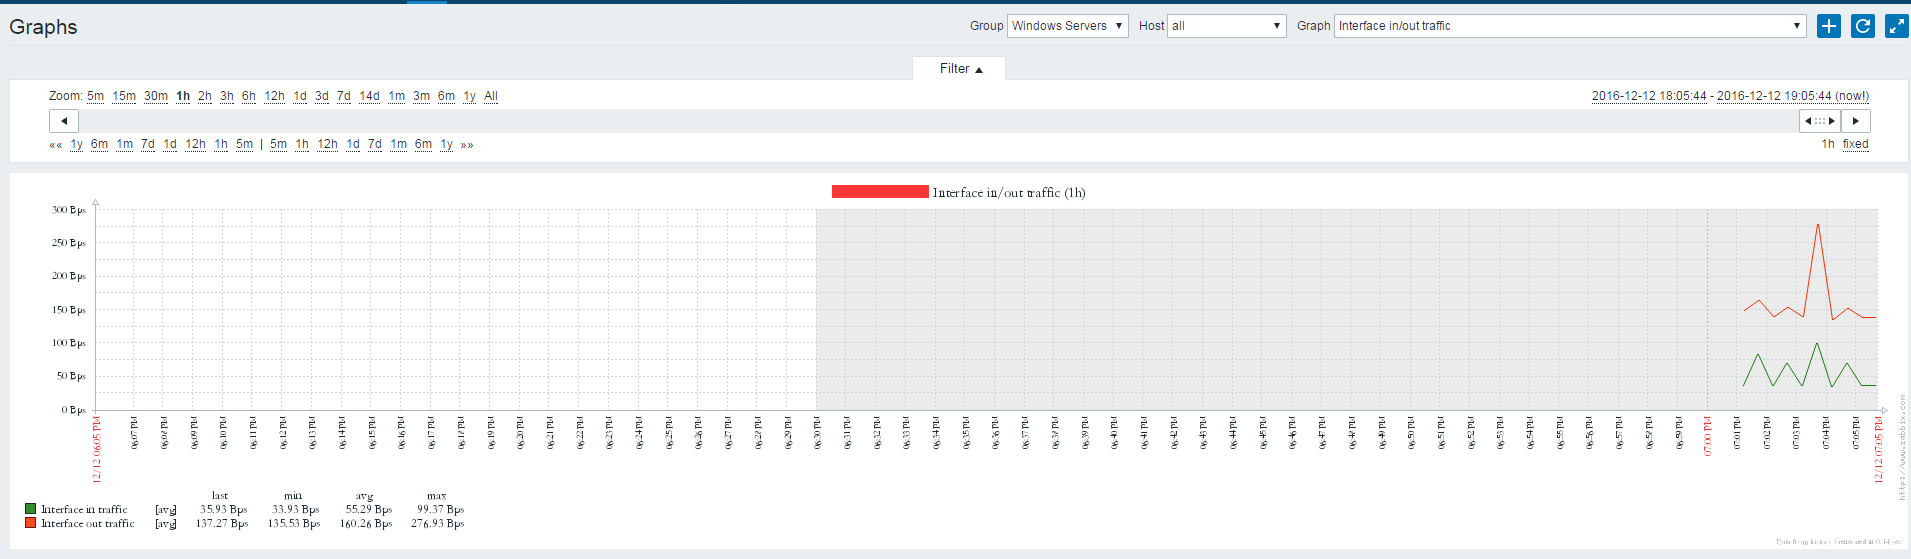
添加监控图表